
Background
In Spring 2020, the City of Craig switched disinfection treatment from free chlorine to chloramines to address frequently low free disinfectant residuals in their distribution system. Low disinfectant residuals increase risk of pathogen presence in tap water, which can lead to waterborne disease outbreaks. Since this treatment change could potentially affect water corrosivity, the City and the Department teamed up to conduct a proactive immersion study to simulate whether the chloramines would impact lead and copper levels in the distribution system. In the last article, we discussed the setup of the City of Craig’s corrosion immersion study.
The experiment tested two water scenarios: the free chlorine potable water (control scenario) and chloramine water (chloramine test scenario). Since individual home plumbing materials vary in the distribution system, three materials were tested: lead, copper with lead solder, and brass. Each material was tested under both water conditions with the water in the jars being changed out three times per week.

Figure 1: Jars with copper with lead solder and brass coupons. The experiment took place from early October 2019 to late January 2020, over approximately 13 weeks. For the first 6 weeks, all the sample jars were filled with the free chlorine water. This stabilized the metal samples and simulated the current conditions of the distribution system pipes. The second 7 weeks, half of the jars were filled with the free chlorine water (control scenario) and half the jars were filled with the future chloramine water (chloramine test scenario).
Craig water treatment staff created the test chloramines water by dosing ammonia to the free chlorine water and checking the total chlorine and ammonia concentrations. The staff refreshed the water in the jars three times per week. Water from each jar was collected and the three samples combined into a single sample per week per jar, which is called taking a weekly composite sample. The composite samples were analyzed for lead and/or copper at the State laboratory.
Lead results
Composite lead concentrations were analyzed weekly from jars containing one of two types of metal coupons. Immersion test results are shown in the four graphs below. The free chlorine (control) scenario is the blue-dashed line and the future chloramine scenario is the red line.
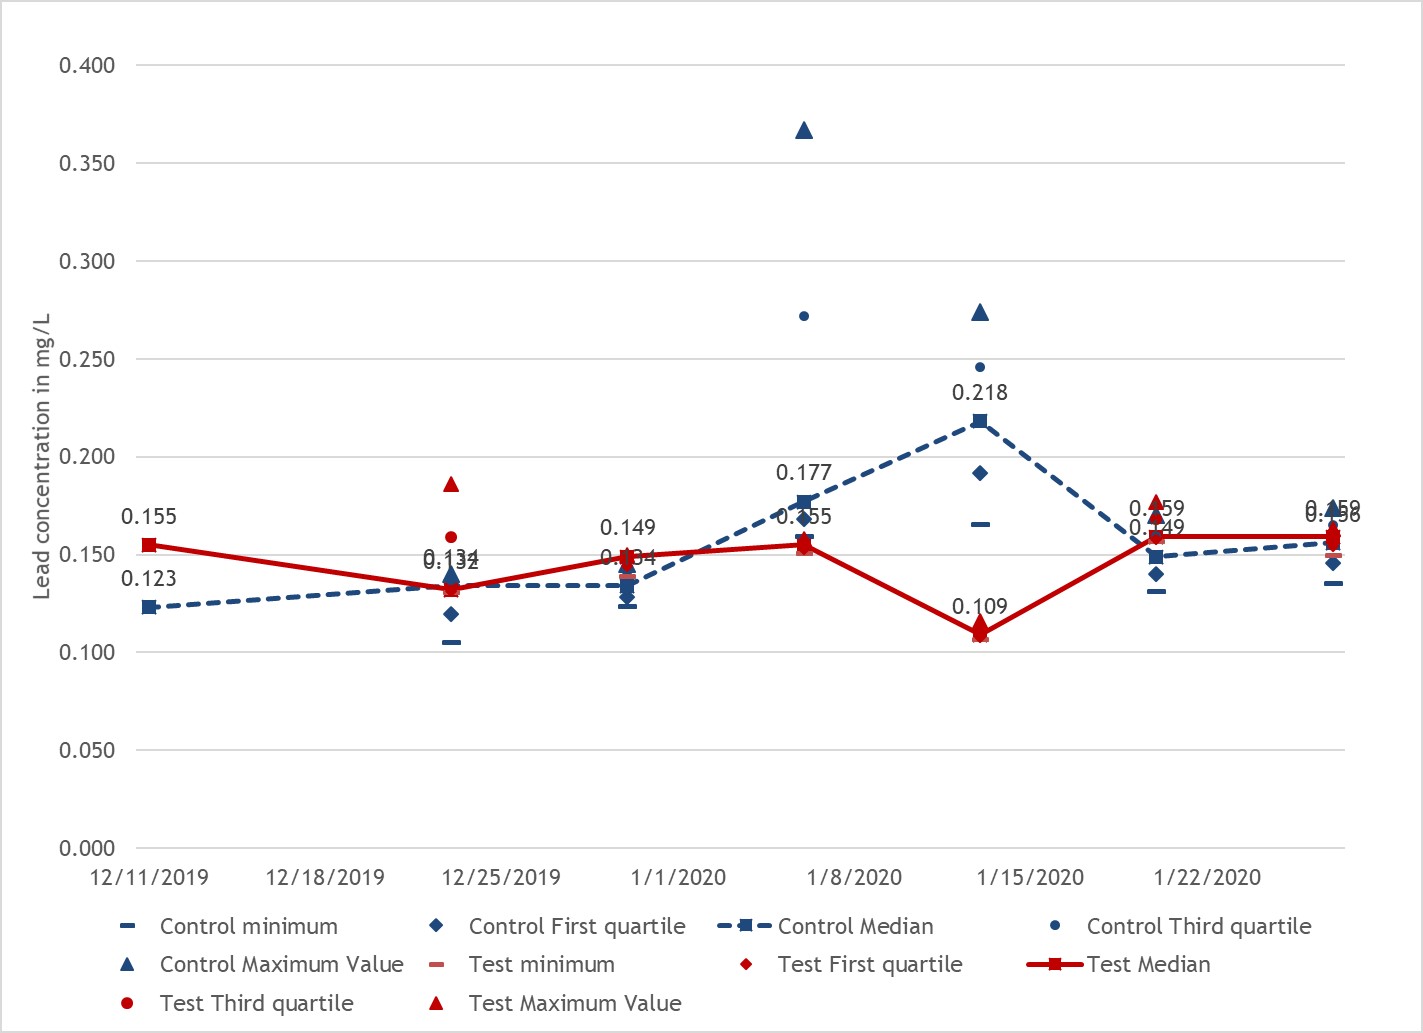
Figure 2: Weekly lead concentrations from jars with immersed lead coupons. Note: The December 11, 2019 data only has one sample per scenario due to a compositing issue.

Immersion tests are imperfect and the cause of the lead concentration spike in the control scenario in mid-January is unknown. The median lead concentration between the test condition scenario (chloramines) and the control scenario (free chlorine) with both types of coupons was similar. Based on the immersion tests results, we don’t expect introducing chloramines into Craig’s distribution system to meaningfully affect the existing lead concentrations at customer’s taps. Craig’s 90th percentile average lead concentration from 2018 and 2019 was 0.0026 mg/L. The lead action level is 0.015 mg/L and the maximum contaminant level goal is 0.0 mg/L. The EPA and the Centers for Disease Control and Prevention (CDC) agree that there is no known safe level of lead in a child's blood. Lead is harmful to health, especially for children, therefore it is always advisable to minimize lead concentrations in water to the extent possible.
Copper results
Composite copper concentrations were analyzed weekly from jars containing one of two types of metal coupons. Figure 4 is the copper with lead solder coupon results and Figure 5 is the brass coupon results.

Figure 4: Weekly copper concentrations from jars with immersed copper with lead solder coupons.

Figure 5: Weekly copper concentrations from jars with brass coupons.
Conclusions and Next Steps
The median copper concentration between the test condition scenario (chloramines) and the control scenario (free chlorine) with both types of coupons indicate that some copper release may be expected. The immersion tests results indicate that introducing chloramines could increase copper concentrations by approximately 17% for the copper with lead solder coupons to 36% for the brass coupons. The immersion test is an experimental simulation and the model results may not be linearly correlated to the actual 90th percentile lead and copper results in the distribution system (e.g., a 36% jar results may not be a 36% increase in the 90th percentile).
Craig will be monitoring lead and copper every 6-months for at least a year to ensure that the actual 90th percentile lead and copper results do not exceed the action levels. The copper action level and maximum contaminant level goal is 1.3 mg/L. In 2018 and 2019, Craig’s 90th percentile average copper concentration was 0.21 mg/L. Copper does not have the same health impacts as lead and is not a concern for developmental effects in children. Even though there may be a slight copper increase, based on the 2018/2019 customer tap sample results combined with the immersion study results, the potential copper concentration increase at customer’s taps should not affect public health.
For more information on immersion testing please see the department’s Lead and Copper Corrosion Bench-Scale Testing Guidance Manual.